| Millies-Lacroix Data Reduction Method (as seen in TM #6, page 20) | ||||
| All data in inches | Center of Zones | r | Zone Errors | |
| Diameter (req.) = | 10 | Zone 1 = | 0.5 | 0.068954108 |
| Radius (req.) = | 5 | Zone 2 = | 1.5 | 0.022984703 |
| Focal Ratio (req.) = | 5.7125 | Zone 3 = | 2.5 | 0.013790822 |
| ROC = | 114.25 | Zone 4 = | 3.5 | 0.009850587 |
| Zone 5 = | 4.5 | 0.007661568 | ||
| Outer Edge = | 5 | 0.006895411 | ||
| (r^2)/(2R)= | 0.10940919 | Rho = | 0.000150884 | |
| Lambda = | 0.00002165 | |||
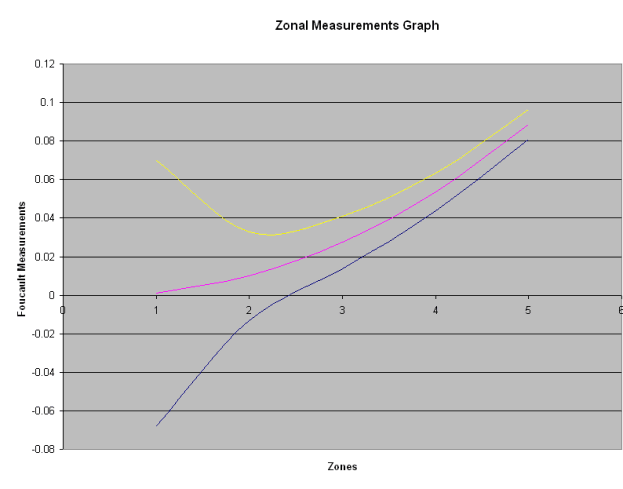
| Minimum | Nominal | Maximum | Tested Readings | |
| Exact Center | 0 | 0 | 0 | 0 |
| Zone 1 | -0.06786002 | 0.00109409 | 0.0700482 | |
| Zone 2 | -0.01313788 | 0.00984683 | 0.03283153 | |
| Zone 3 | 0.01356148 | 0.0273523 | 0.04114312 | |
| Zone 4 | 0.04375992 | 0.0536105 | 0.06346109 | |
| Zone 5 | 0.08095988 | 0.08862144 | 0.09628301 | |
| Outer Edge | 0.10251378 | 0.10940919 | 0.1163046 | |
| Zone | IR (req.) | OR (req.) | Difference | Center of Zone |
| 1 | 0 | 1 | 1 | 0.5 |
| 2 | 1 | 2 | 1 | 1.5 |
| 3 | 2 | 3 | 1 | 2.5 |
| 4 | 3 | 4 | 1 | 3.5 |
| 5 | 4 | 5 | 1 | 4.5 |
| NOTES: |
| 1) Zone errors are from the calculation: |
| (2R (1.22*Rho*Focal Ratio)) / (Center of Radius for Each Zone) |
| 2) Once the error has been computed it is added to and subtracted |
| from each Zone's (r^2/2R) figure, giving the maximums and minimums. |
| 3) Lambda is constant at .00002165" or .00055mm. |
| 4) req. indicates a "required field". |
Version 1.1
Last Updated on 7/23/99 - Downloadable version in Excel97 <here>
By Roger Herzler
Email: rherzler@cts.com
Summary of changes: Changes made because of redesign of mask(s). No technical errors (if any) were corrected.